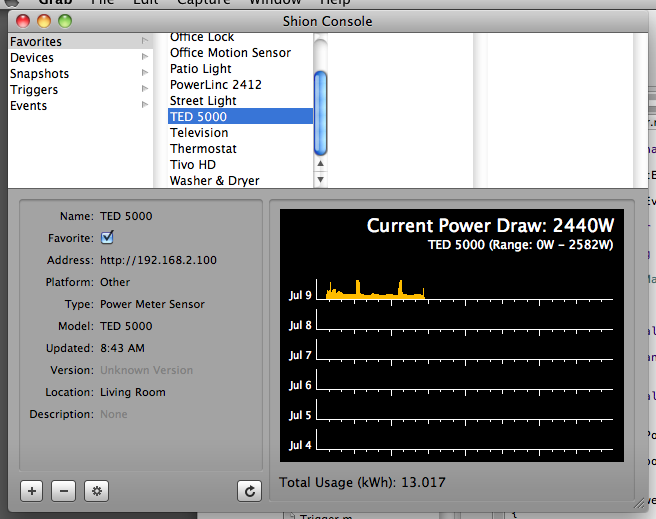
This has been a good week for Shion development. In the past few days, I’ve added support for Morning Industry computer-controllable locks using the MorningLinc, I’ve been tracking the power consumption of my washer & dryer combo unit using Shion’s new support for the iMeter Solo, and yesterday evening I added support for the TED 5000 smart meter.

Despite its early stage of development, the TED 5000 may be one of the better devices I’ve had the pleasure of supporting in Shion. There was an initial struggle installing the thing (it doesn’t have WiFi and can be picky about which power outlet it can use to communicate with the hardware in the breaker box), but once I had it working, adding support was simple. It uses a simple & straightforward XML API for communicating its readings, and those readings are probably being updated more frequently than I’ve designed the Shion events infrastructure to handle. Using the code I wrote for the iMeter earlier this week, I was able to get Shion talking to the meter with full graphing in less than an hour.
The major reason that I wanted to support this uint was to begin building a model of my electricity consumption on a per-device basis. Since it isn’t feasible for me to connect an iMeter or SynchroLinc to every device, I’m planning on using Shion’s stored state to generate statistical models that describe how much each device contributes to the overall power draw. Device states go on the left-hand of the equation, the total power draw goes on the right-hand side of the equation, and I run a simple linear regression to get the coefficients. That’s the theory & plan and I’ll be posting some entries later over the next couple of weeks describing how it works in practice.
One bit of new information that I discovered was the huge power draw that the air conditioner used. From my rough readings, my home has about a 400W “base” draw consisting of various appliances & computers that are left on at all times. When the air conditioner starts, it adds 1800-2000W to the power consumption, far dwarfing the other devices. I expected a major power draw, but not one that quadrupled my overall consumption!
Since my Venstar Insteon thermostat only reports mode, set points, and temperature and NOT if the unit is running, I’ll have to get creative in my statistical modeling to associate more closely the observed power draw with the the spikes in electricity consumption. I have several ideas about how I might accomplish this, and will be posting updates in the weeks ahead. Stay tuned.


Recent Comments